MM OUTPUT & TRAINING
The ASCM Global Health Supply Chain Maturity Model v8.0 self-assessment helps teams determine a level of maturity for the supply chain being evaluated, as well as for each category of activities within the supply chain. Immediately after submitting an assessment, a team is taken to an online site that displays their supply chain evaluation.
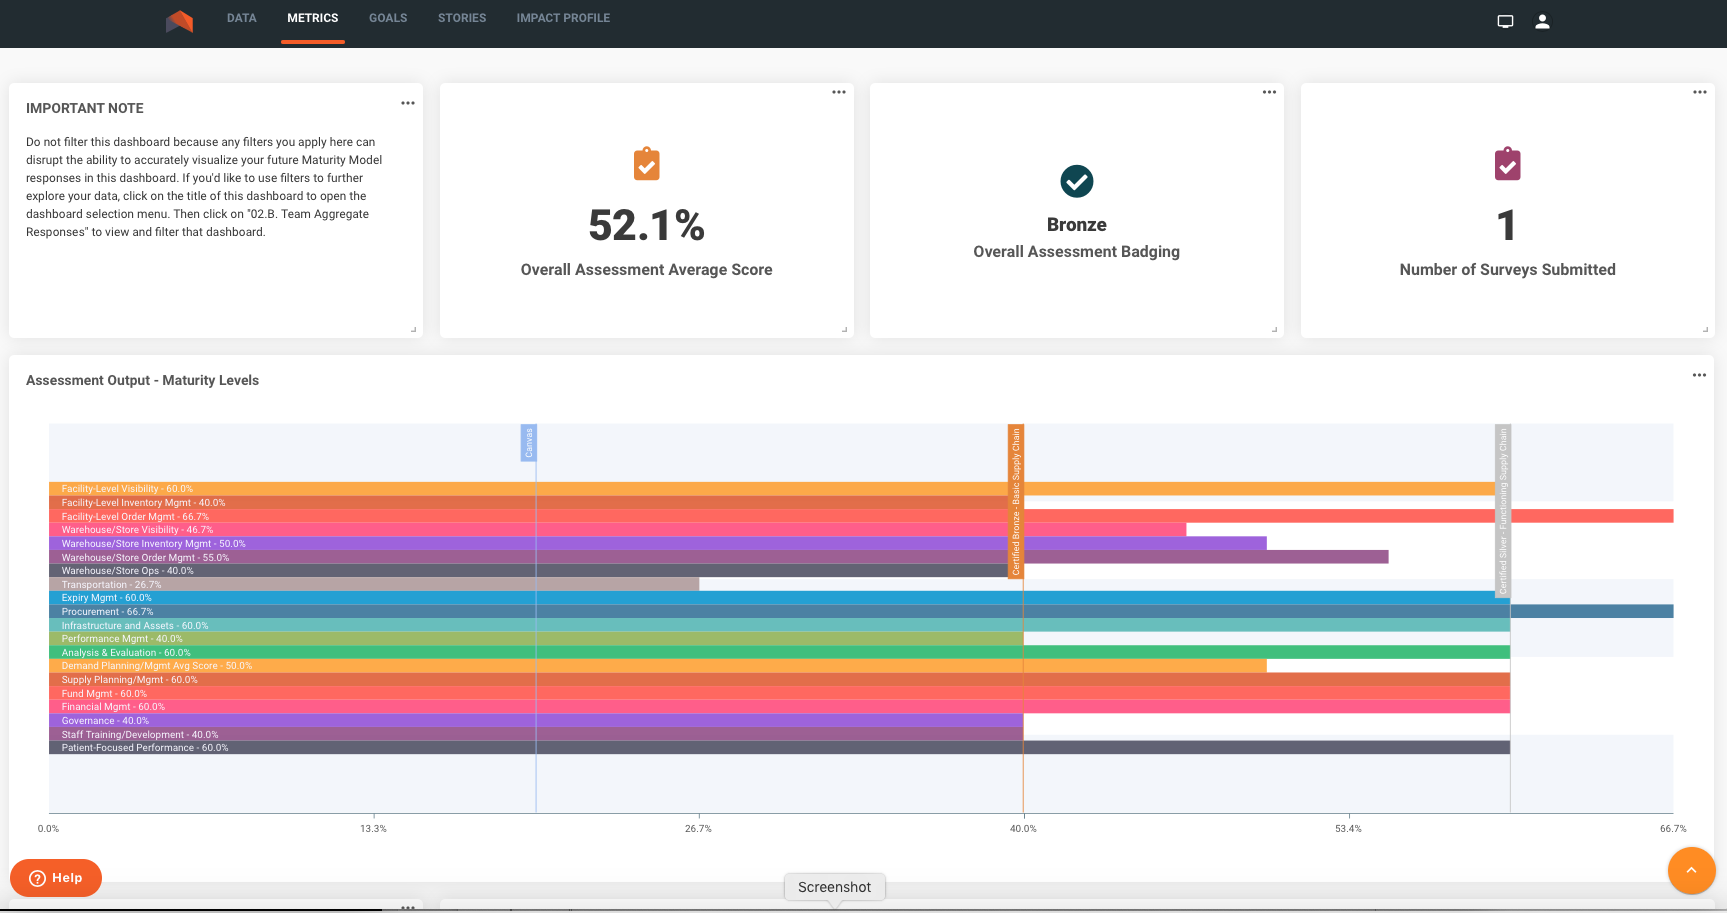
The output displayed shows teams their overall maturity level for the supply chain, as well as the maturity levels for categories and the questions within them (category findings are based on an average of question answers within the category). This data visualization helps teams to determine where they need to focus their supply chain improvement plans. The levels of maturity are presented as percentages:
20-39% = Canvas
40-59% = Bronze
60-79% = Silver
80-99% = Gold
100% = Accredited
There are two levels of data visualization access. How users answer the Registration question in the profile section of the Maturity Model questionnaire will determine the level of data visualization available:
- FULL ACCESS: Available to individuals/teams who have been assigned a password-protected account for data visualization.
- LOGIN INSTRUCTIONS: Individuals/teams enter a Registration ID and receive access to their Assessment Output, as well as access to all data for review and filtering (via the password-protected account). NOTE: This level of access is reserved for ASCM GHSC Maturity Model stakeholders.
- LIMITED ACCESS: Available to all individuals/teams.
- LOGIN INSTRUCTIONS: Individuals/teams an email address and are asked to create an account upon submitting an assessment. These users will access Assessment Output.
Overall Assesment Output and Category Output
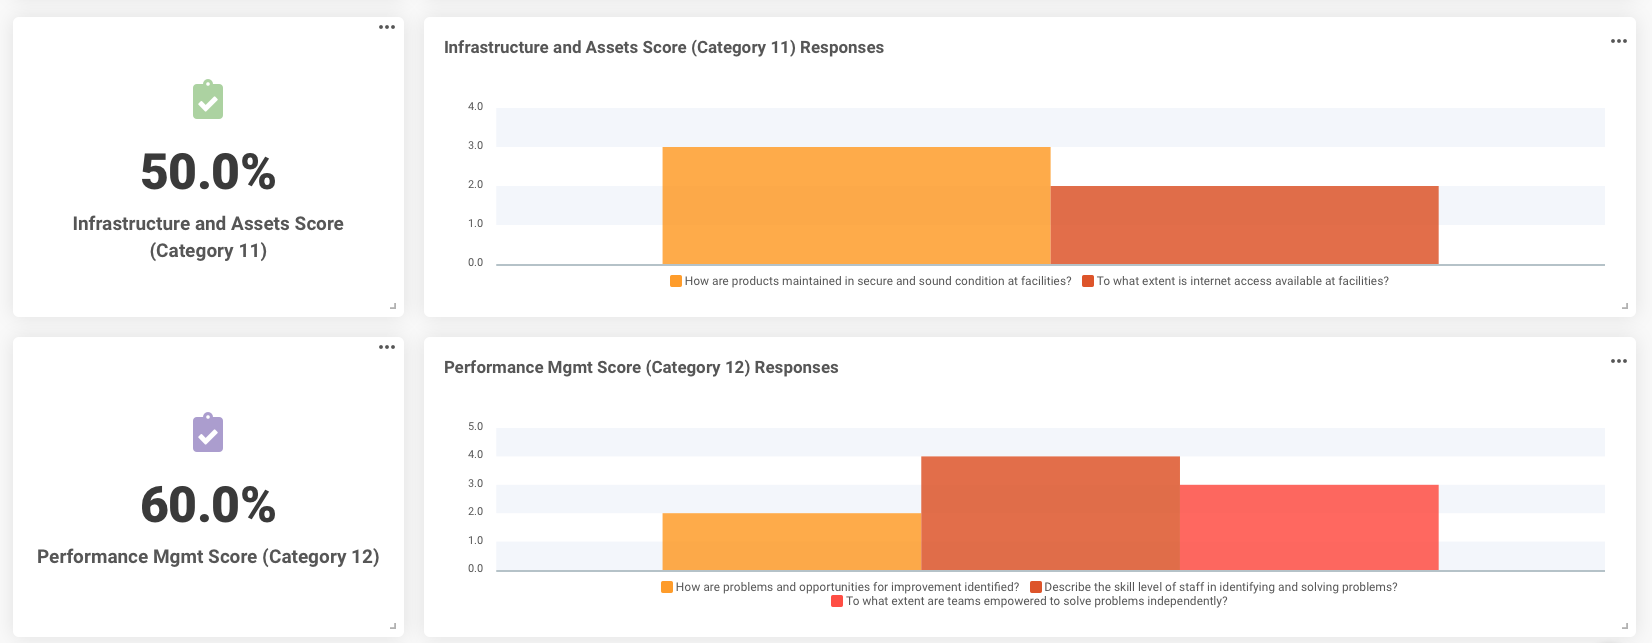
1=Canvas-level answer
2=Bronze-level answer
3=Silver-level answer
4=Gold-level answer
5=Accredited-level answer
Question Output
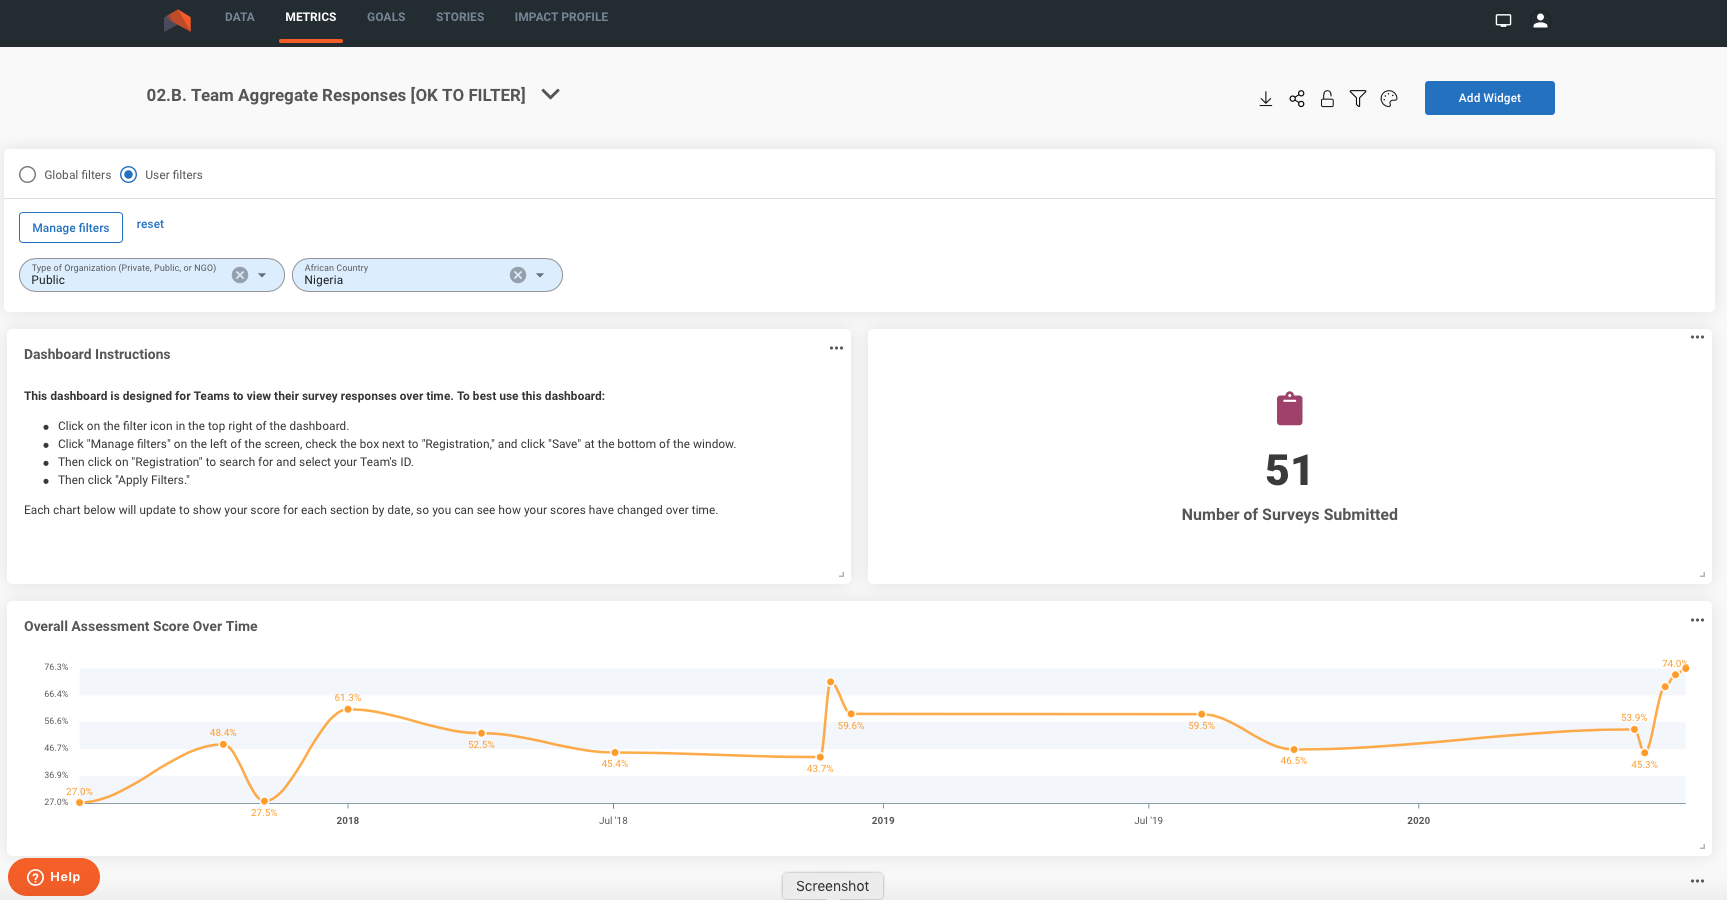
The Maturity Model data visualization site also allows teams to review past data and aggregate data from multiple assessments, filtering the assessments by different criteria included in the assessment questionnaire, including by:
- Country
- Region
- Date of completion
- Maturity Model version
- Type of organization
With data visualization capabilities, teams are able to identify progress in improving their supply chains, as well as where weaknesses still exist. Supply chain stakeholders can use the online tool to better understand where resources may be required to enhance supply chain performance.
Aggregated and Filtered Assessments
Overall Assessment Scores by Version and Over Time
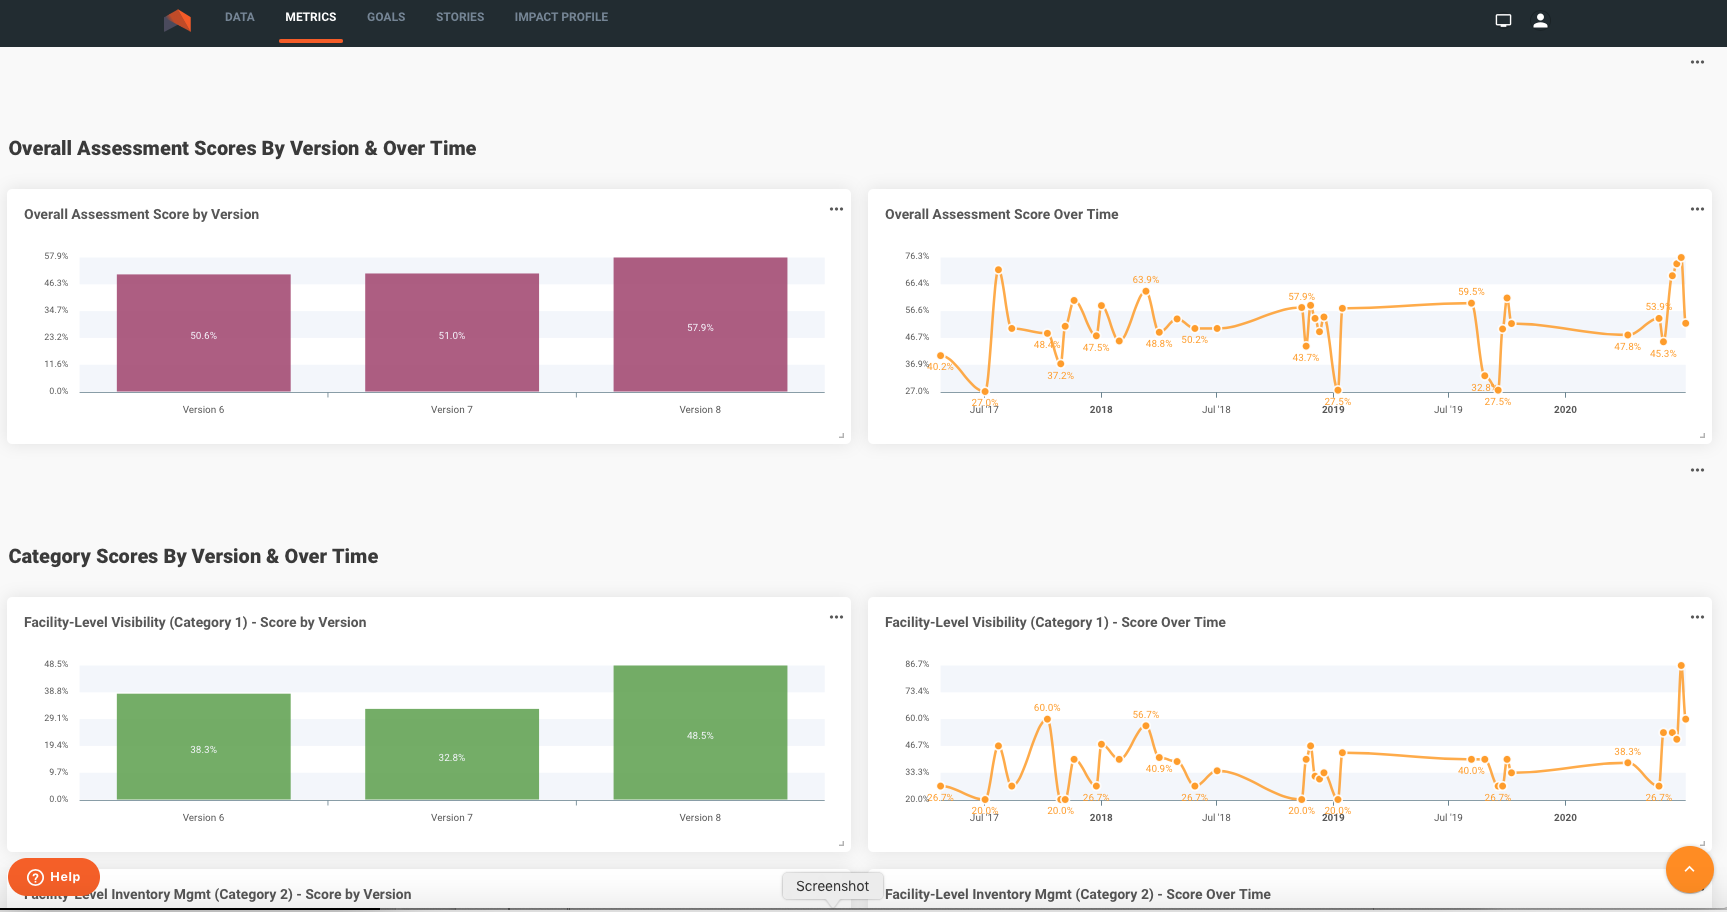
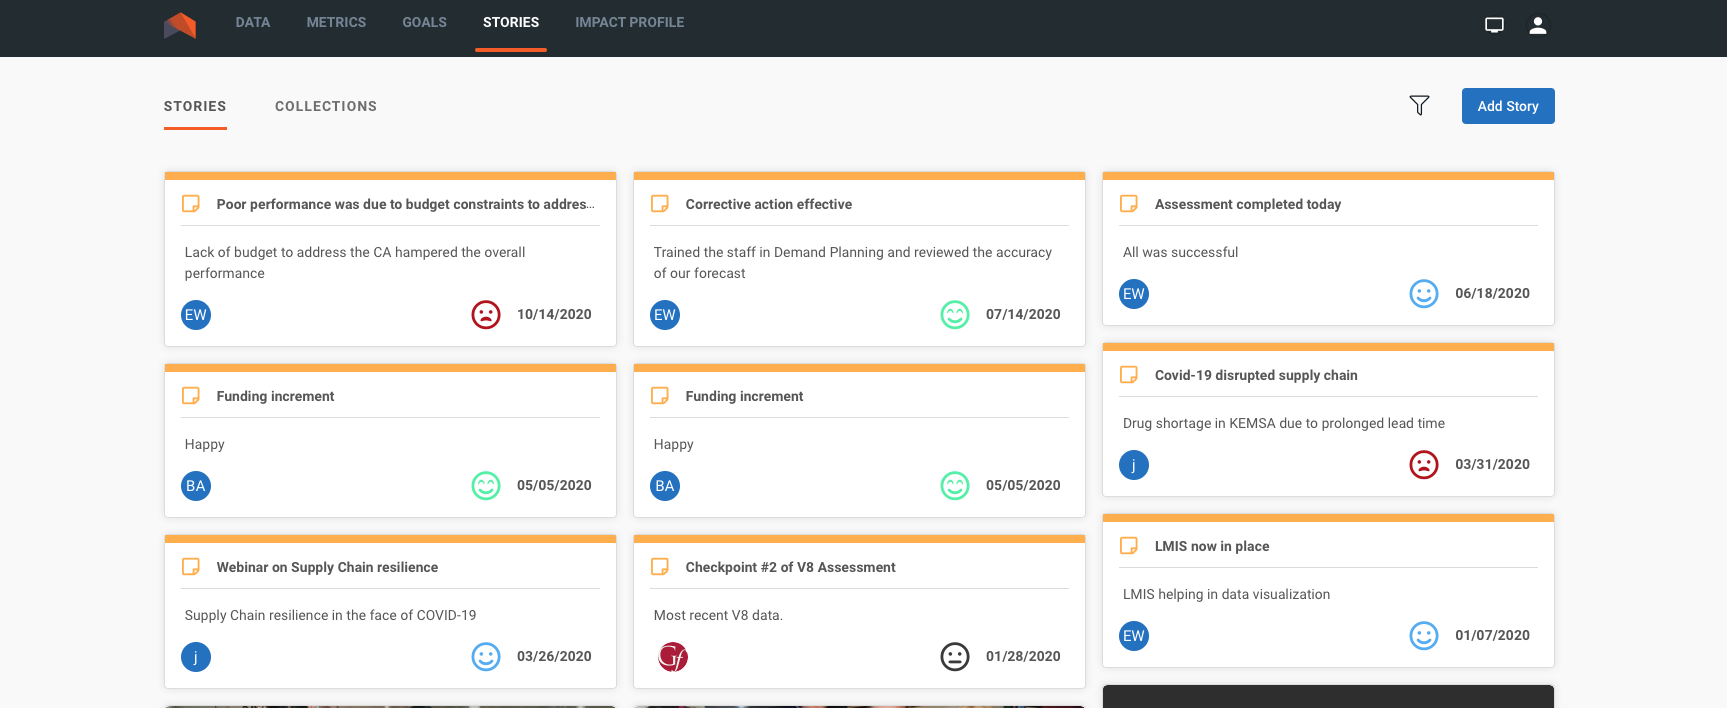
The data visualization site also includes areas where teams and stakeholders can set and track goals, as well as communicate successes and challenges.
Supply Chain Stories
